Client Portfolio Prioritisation
Which clients should management protect, grow, fix or question? Nine charts that answer it as one story.
- Context
- Data Visualisation coursework, with Leu Chun Yang and Ethan Chuwa
- My part
- The client prioritisation track: action classes, movement review and the Sankey
- Stack
- Python, Plotly, Dash, pandas
- Year
- 2026
The problem
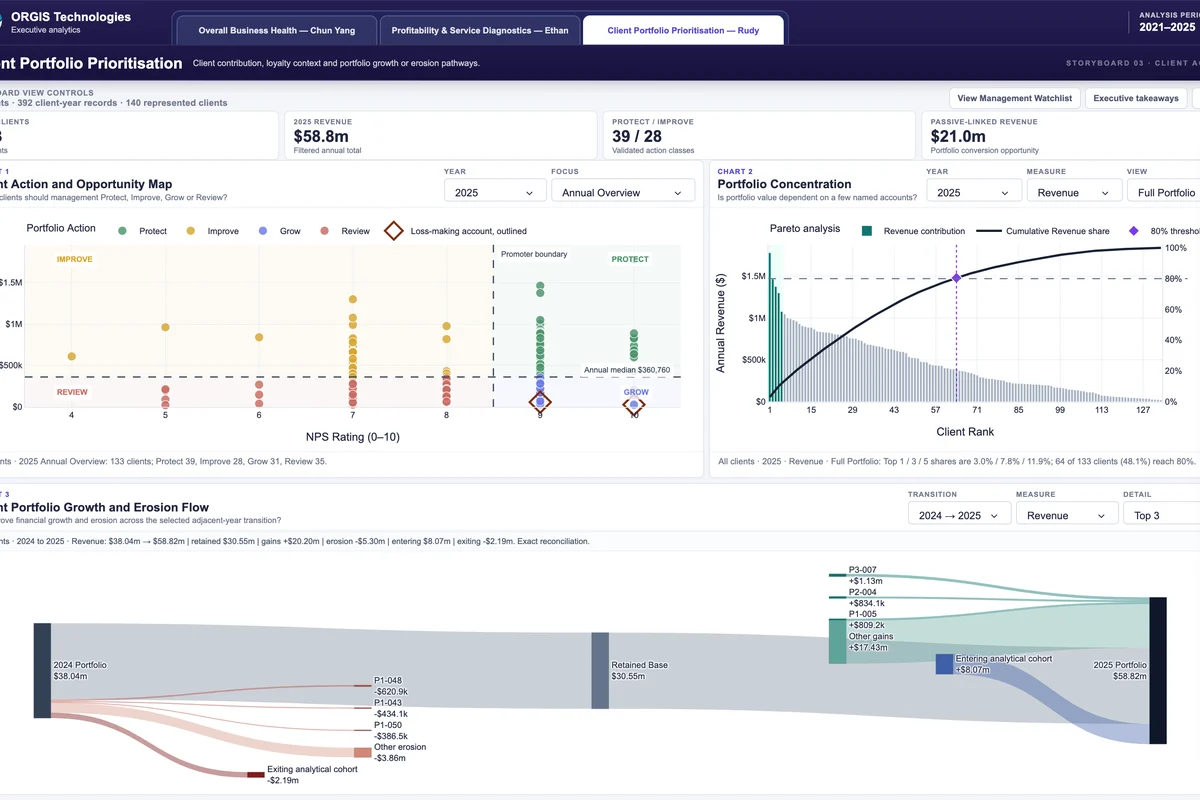
An IT systems integrator grew revenue from $7.58m in 2021 to $58.82m in 2025, at a 44.1% gross margin. The brief asked how it could keep growing profitably while keeping clients satisfied, and which sectors, costs and clients management should prioritise.
Company totals can’t answer the last part. A healthy year can hide one large client quietly shrinking, a loyal account that is too small to notice, or a big one that is only lukewarm. Management needs names: which accounts to protect, which to fix, which to grow, and which movements to check before anyone calls them churn.
One story in three parts
Three of us, one track each, integrated into one Dash storyboard with shared navigation. Leu Chun Yang covered overall business health: growth, revenue concentration and loyalty-linked revenue. Ethan Chuwa covered profitability, cost structure and service ratings by sector and location. Mine turned both into client-level actions.
Underneath is one verified dataset: 392 client-year records for 140 clients from 2021 to 2025. The survey and finance workbooks each had exact duplicate rows and ten rows for unknown clients; with those removed, every finance record matched a survey record on client and year.
Four actions, from value and loyalty
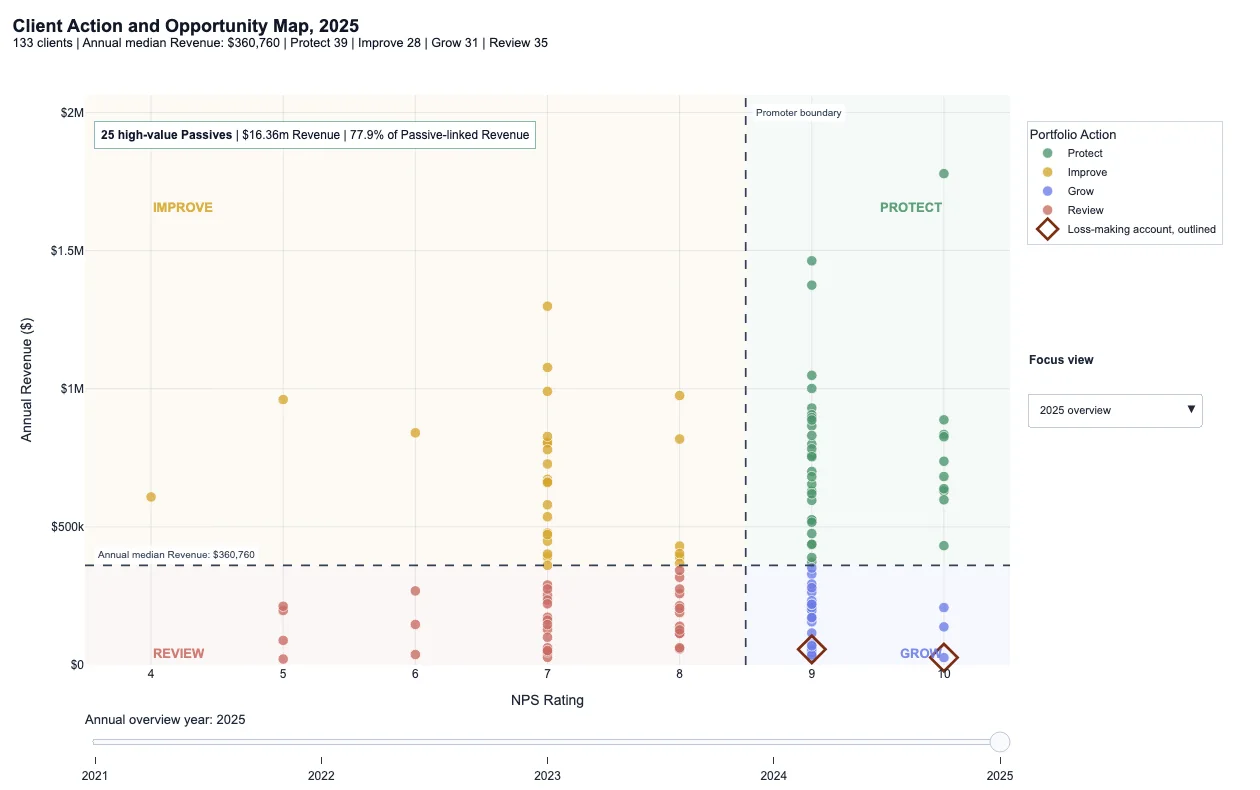
Each client, each year, gets one action from two plain facts: is their revenue above that year’s median, and are they a Promoter (NPS 9 or 10) or not.
Protect
Revenue Above the medianLoyalty Promoter2025 clients 39
Improve
Revenue Above the medianLoyalty Passive or Detractor2025 clients 28
Grow
Revenue Below the medianLoyalty Promoter2025 clients 31
Review
Revenue Below the medianLoyalty Passive or Detractor2025 clients 35
| Action | Revenue | Loyalty | 2025 clients |
|---|---|---|---|
| Protect | Above the median | Promoter | 39 |
| Improve | Above the median | Passive or Detractor | 28 |
| Grow | Below the median | Promoter | 31 |
| Review | Below the median | Passive or Detractor | 35 |
The median is computed across all clients before any filter, so narrowing the view to one sector never moves a client into a different box. The map also outlines loss-making accounts, which revenue alone would hide.
The action map, 2025
Where the growth came from
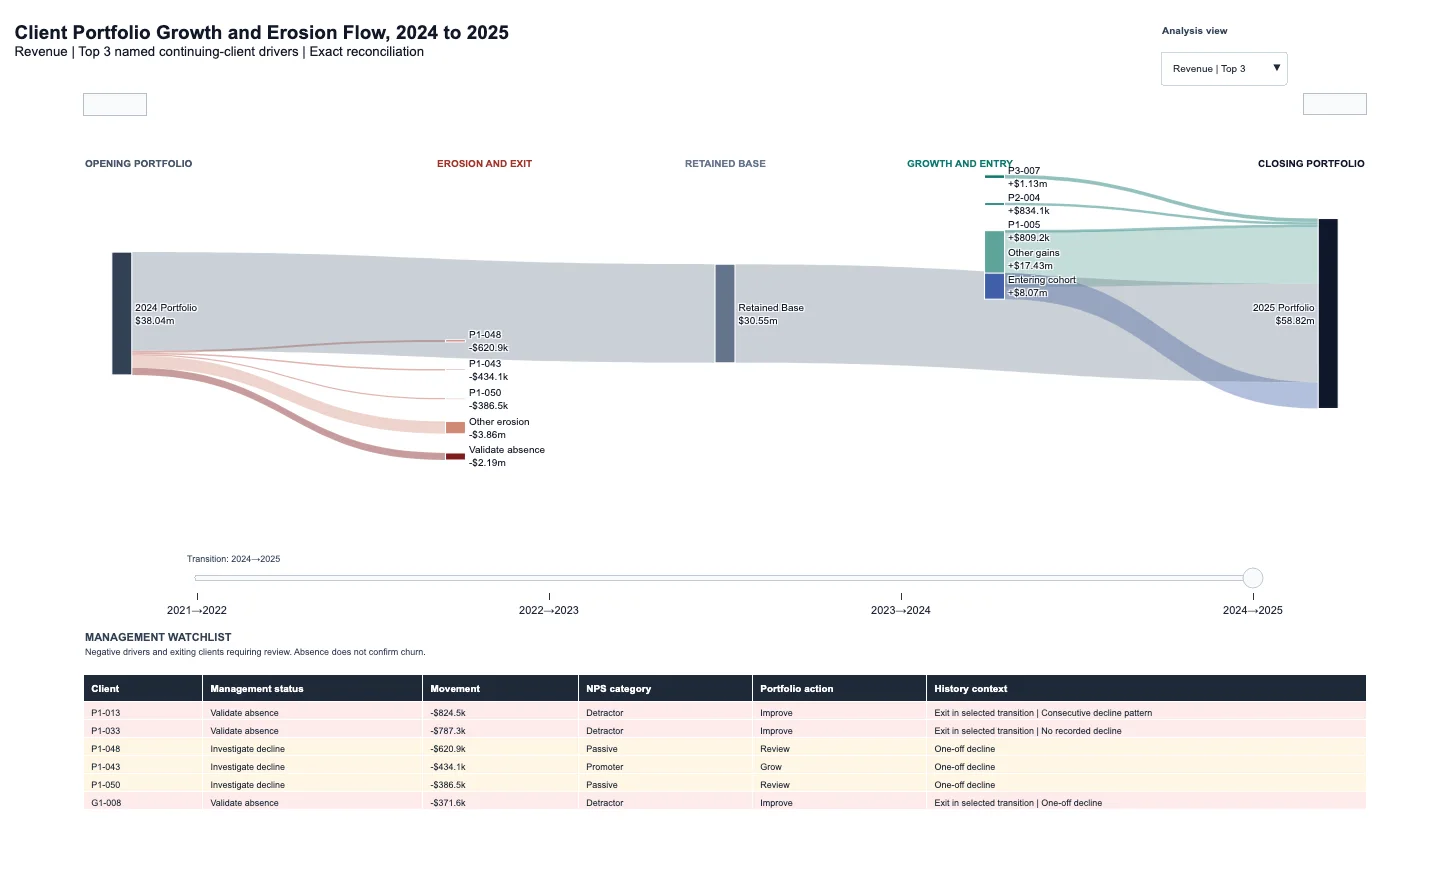
Between two years, revenue can rise while real clients shrink. The Sankey reconciles each transition exactly: the opening portfolio, what eroded or left, the retained base, what grew or entered, and the closing portfolio, with the largest named movers drawn as their own flows.
Next to it, a movement review keeps a separate question separate. A client’s action says where they stand; their movement status says what their revenue has been doing: validate an absence, investigate an ongoing or repeated decline, monitor a single drop, or no alert. A missing year breaks a run of declines, because continuity can’t be assumed across a year nobody observed.
Growth and erosion, 2024 to 2025
Decisions
Two facts per client, not a score
A blended priority score would be hard to argue with and harder to act on. Above or below the median, Promoter or not, gives four boxes a manager can read aloud, and the dashboard lets them check any client’s position.
Fix the threshold before filtering
If the median moved with each filter, a client could be Protect in the full view and Improve in their sector view. Computing it once per year on all clients keeps a client’s action stable however the dashboard is sliced.
Absence isn’t churn
A client missing from next year’s data might have finished a project, been invoiced late, changed id or genuinely left. The analysis calls it “entering” or “exiting the analytical cohort” and puts the account on a list to validate, instead of reporting churn it can’t prove.
Keep action and movement apart
A high-value Passive can be Improve and also be declining; merging the two would let one signal overwrite the other. Both stay visible, and a fixed precedence only picks the single label shown in the watchlist, with absence first so no revenue change is ever invented for a client with no data.
Reconcile to the dollar
The Sankey’s flows sum exactly to the opening and closing totals. A chart that explains growth has to add up, or the first question from finance ends the conversation.
Results
+$20.78m
Revenue growth 2024 to 2025: +$14.90m from continuing clients, +$8.07m entering, −$2.19m exiting
$16.36m
Held by 25 high-value Passive clients in 2025, the clearest accounts to move toward Promoter
64 of 133
Clients needed to reach 80% of 2025 revenue; Gini coefficient 0.432
Opening portfolio, 2024
Revenue $38.04m
Gains from continuing clients
Revenue +$20.20m
Declines from continuing clients (43 of them)
Revenue −$5.30m
Entering the analytical cohort
Revenue +$8.07m
Exiting the analytical cohort
Revenue −$2.19m
Closing portfolio, 2025
Revenue $58.82m
| 2024 to 2025 | Revenue |
|---|---|
| Opening portfolio, 2024 | $38.04m |
| Gains from continuing clients | +$20.20m |
| Declines from continuing clients (43 of them) | −$5.30m |
| Entering the analytical cohort | +$8.07m |
| Exiting the analytical cohort | −$2.19m |
| Closing portfolio, 2025 | $58.82m |
Group coursework on a supplied dataset, run as a local Dash app. These are gross-level figures and observed associations with survey responses: no operating costs, no cash flow, and nothing causal. The movement statuses are signals for someone to investigate, not findings.
Limits
- Gross profit only: the data has no operating expenses, so a “profitable” client here may not be after overheads.
- NPS comes from one survey response per client per year, so one person’s mood can move a large account between boxes.
- The median split treats a client just above and just below it as opposites.
- The decline patterns can’t see contract cycles or project timing, the most likely reasons for many one-off drops.
Up next
All work