Career & Labour-Market Analysis
Pay, flexibility, demand and job security, read together rather than ranked on salary alone.
- Context
- Data analysis coursework
- My part
- Everything: cleaning, harmonisation, analysis, a UiPath extension
- Stack
- Python, pandas, Matplotlib, Seaborn, UiPath
- Year
- 2025
The problem
Careers get compared on one number: a starting salary, or the latest employment rate. That hides everything else a person is actually choosing between, like whether the job lets you work remotely, how much experience it asks for before letting you in, whether demand for it holds up over a decade, and how often people in that industry get retrenched.
Two analyses, two sides of the same question. One looks at what employers post; the other at what happened to Singapore graduates, set against the labour market around them. Neither dataset was built to be compared, so most of the work was making the comparison fair.
Job postings: computing against everything else
Five postings files, 123,849 jobs, joined on job id into one table with only the fields the question needed. Most postings carry no pay, so the working set is the 36,073 that do, cut to 33,708 after cleaning.
- One salaryThe median salary where a posting gives one, otherwise the midpoint of its minimum and maximum; non-USD pay converted to USD.
- Outliers by pay periodUnrealistic salaries removed with the IQR rule inside each pay period, since an hourly and a yearly figure can’t share one threshold. Biweekly pay, with only 9 rows, was dropped rather than trusted.
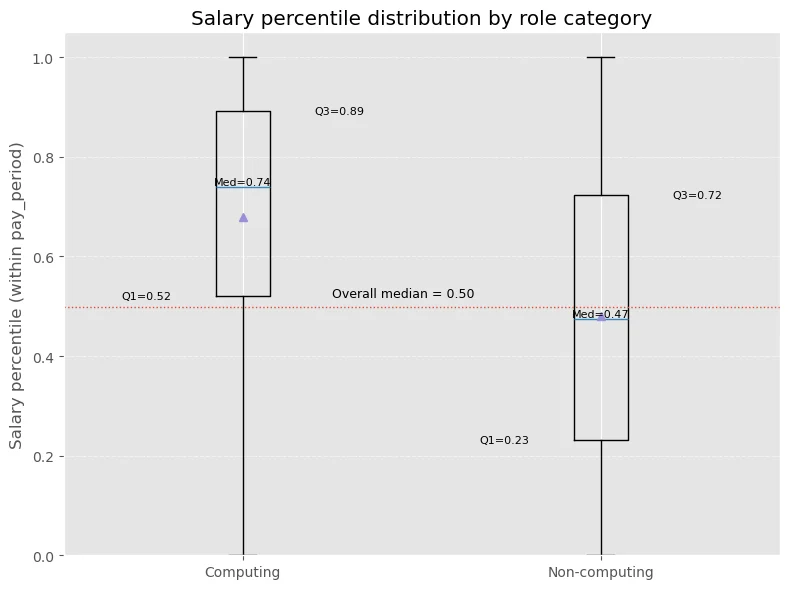
- Percentile, not annual payTurning an hourly wage into a yearly one means guessing working hours. Instead, each job gets its percentile within its own pay period, and the top quarter counts as high-paying.
- Computing or notClassified from the job title by keywords (software, developer, data, cloud, cyber and so on), with an extra rule for “engineer”, since not every engineer writes code. About 10% of postings came out as computing.
Where each group sits in its pay period
Graduates, set against the labour market
The Graduate Employment Survey gives employability and pay by degree. Two Ministry of Manpower series supply what it can’t: resident employment by occupation, for how steady demand is, and retrenchment incidence by industry, for downside risk. Five fields went through the whole analysis: law, computing and data, healthcare, education and engineering.
- A year that was ten times too smallThe 2012 median salary came out at 310 against 2013’s levels, a ratio of 0.1. Rescaling it would have been a guess without metadata, so 2012 was dropped (78 rows) and the window became 2013 to 2022.
- Explicit mappingEvery school and degree label was mapped to a field from the labels actually in the data, a 220-entry degree dictionary, with keyword rules only as a fallback. The fallback was never needed: all 1,170 rows left after cleaning mapped explicitly.
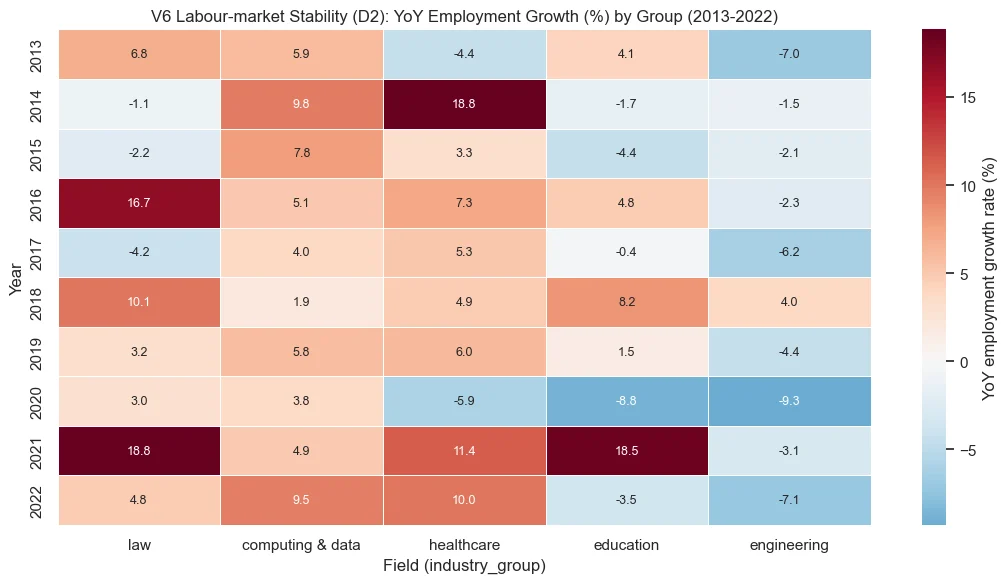
- StabilityYear-on-year employment growth per mapped occupation, summarised by its median per field and year, and its volatility plotted against the size of the job base, so a small occupation’s swings aren’t read as a whole field’s instability.
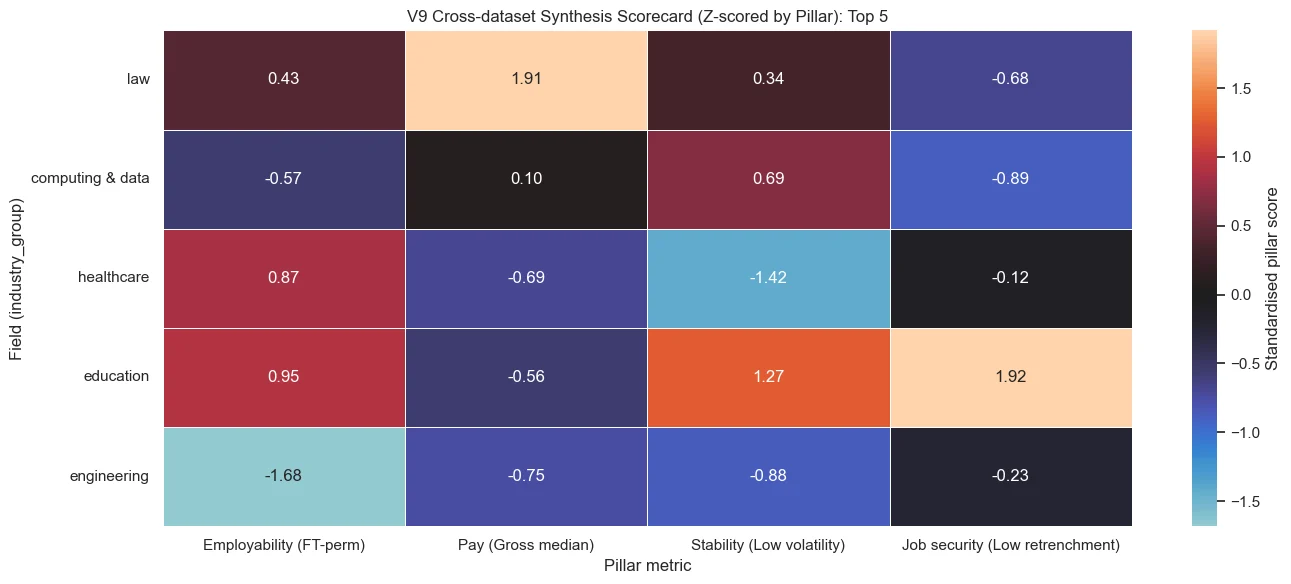
- One scorecardOne representative metric per pillar (employability, pay, stability, job security), averaged over the decade and z-scored across the five fields.
Demand, year by year
The four pillars together
Automating the refresh
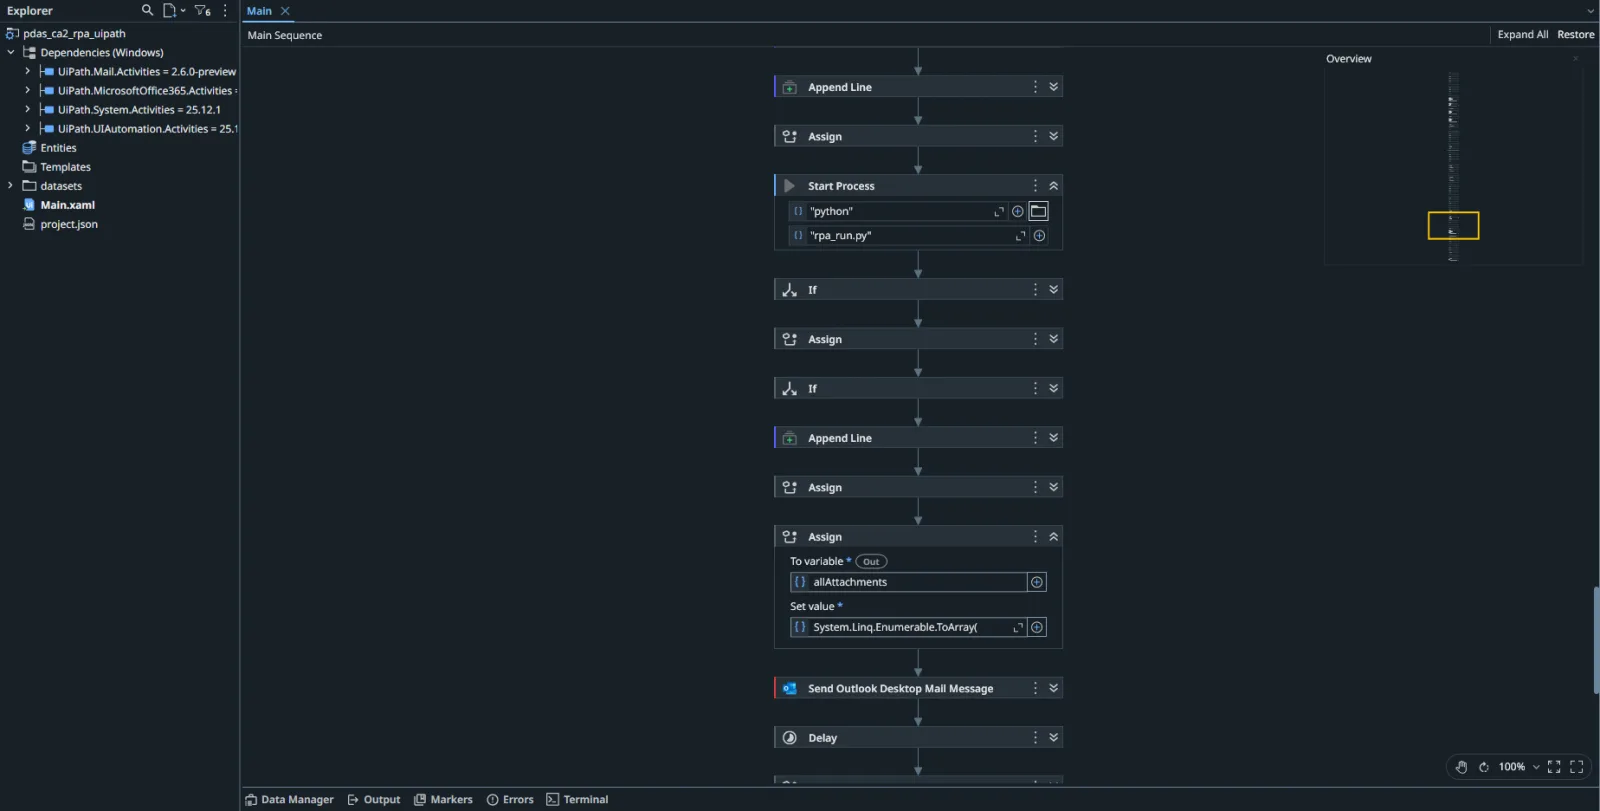
The Ministry of Manpower publishes its series as ZIP files that change every release. A small UiPath workflow downloads them, checks and extracts the archives, picks out the needed CSVs, runs a Python reporting script and emails a summary with the synthesis attached, logging and cleaning up as it goes.
The UiPath sequence
Decisions
Compare pay within its own period
Annualising hourly and weekly pay needs an assumption about hours that the data can’t support. Percentiles within each pay period answer the actual question, whether a job pays well for its kind, without inventing a number.
Drop the anomaly instead of fixing it
The 2012 salaries were almost certainly on a different scale, but “almost certainly” isn’t metadata. Losing one year of eleven is cheaper than a correction that might be wrong and would colour every trend after it.
Map fields from the labels that exist
Linking degrees to occupations and industries is a proxy either way, so it had to be inspectable. Building the mapping from the observed labels, and reporting that all of them mapped explicitly, lets a reader check every assignment.
Show trade-offs, not a winner
No field led all four pillars, and a single ranking would have hidden exactly what the analysis found. The scorecard keeps each pillar in its own column so a reader can weigh upside against risk themselves.
Results
48.6% vs 22.5%
Computing vs non-computing postings in the top quarter of pay for their period
23.6% vs 11.8%
Computing vs non-computing postings that allow remote work
0 of 5
Fields that led on employability, pay, stability and job security at once
Descriptive analysis of public data, individual coursework. Computing roles pay better and are more often remote but ask for more experience, with a smaller junior share. On the graduate side, law leads pay, healthcare looks most defensive, and education is highly employable but weakest on downside risk. None of this is causal, and the field-to-industry links are proxies.
Limits
- The raw datasets aren’t in the public repository, so the notebooks are for reading, not rerunning.
- Computing is decided by title keywords; a “data entry clerk” and a “data engineer” need the rules to get them right, and some won’t.
- Postings with pay are only 29% of the total, and they may not represent the ones without.
- The scorecard mixes directions: higher is better for two pillars and lower for the other two, which makes it easy to misread at a glance.
- Views are used as a demand signal, but views measure applicant interest in one site, not hiring.
Up next
All work