Skip to content
Back to projects

Featured visual

PCA cluster map from the selected six-cluster customer segmentation solution.

Tools and methods

Why it stands out

  • Connects four distinct ML problem types into one coherent body of work instead of four disconnected notebook links.
  • Keeps preprocessing, baselines, model comparison, and interpretation visible across every project.
  • Uses forecasting and segmentation as the strongest anchors while still showing breadth through classification and regression.

Overview

This page brings four separate machine learning notebooks into one narrative. The value is not that every project is equally strong. The value is that the work repeatedly makes the same good decisions across different problem types: inspect the data, keep preprocessing explicit, compare against baselines, and evaluate results in a way that matches the structure of the task.

Together, the projects cover binary classification, regression, unsupervised segmentation, and time-series forecasting. Taken together, they show range across core ML problem types without losing workflow discipline.
Why these projects belong together

These notebooks work better together than as isolated project pages. Seen together, they show practical range across core ML problem types while also making the workflow easy to trust: decisions are stated, alternatives are compared, and outcomes are interpreted rather than reduced to raw scores.

The strongest anchors are energy forecasting and customer segmentation, which show the clearest evaluation discipline. The classification and regression work still matter because they widen the coverage and reinforce the consistency of the workflow.

The page spans four different ML problem types, but the workflow stays consistent: define the task clearly, compare against baselines, and evaluate results in a way that matches the structure of the problem.

Classification

Factory machine status

Predicting machine faults from process and wear variables under a heavily imbalanced target.

Forecasting

Energy consumption

Forecasting monthly gas, electricity, and water consumption with strict chronological evaluation.

Clustering

Customer segmentation

Grouping customers with evidence-led clustering and stability checks instead of arbitrary persona-making.

Regression

House pricing

Estimating sale prices from mixed tabular features with a log target, engineered features, and pipeline-based preprocessing.

Featured ML projects

These four subprojects stay distinct, but the page keeps them in one frame. The emphasis is on what changed from project to project, and what stayed consistent.

Classification

Factory Machine Status Classification

A binary fault-detection workflow using process variables, explicit preprocessing, and minority-class evaluation instead of accuracy alone. The project compares multiple model families before selecting a tuned Random Forest on faulty-class F1.

  • Dropped rows with missing quality, removed IDs, and kept imputation and scaling explicit.
  • Used faulty-class precision, recall, and F1 because the target is only 3.39% positive.
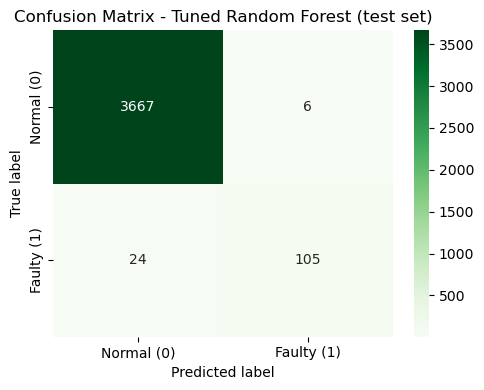
  • Final tuned Random Forest reached 0.875 F1 on the held-out test set.
Classification confusion matrix
Confusion matrix for the tuned random forest in the factory machine status classification project

This confusion matrix is the clearest snapshot of the project because it shows how the tuned model handles the minority faulty class directly instead of hiding behind overall accuracy.

What it demonstrates

A solid classification workflow with class imbalance awareness, sensible model comparison, and post-fit interpretation through confusion matrices and feature importance.

Forecasting

Energy Consumption Forecasting

The strongest project in the set. It models monthly gas, electricity, and water consumption with a strict chronological split, baseline-first forecasting, validation-led model selection, residual checks, and a 60-month forecast horizon.

  • Used 361 training months, 24 validation months, and 12 test months across 397 monthly observations.
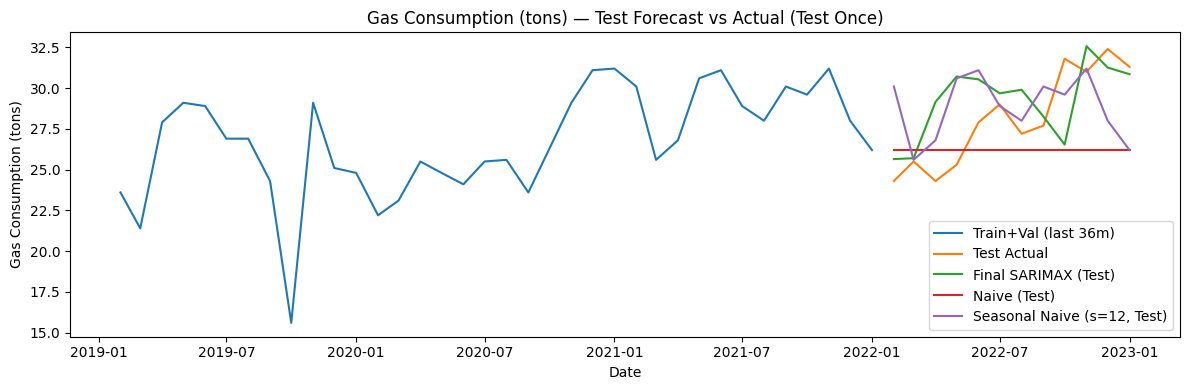
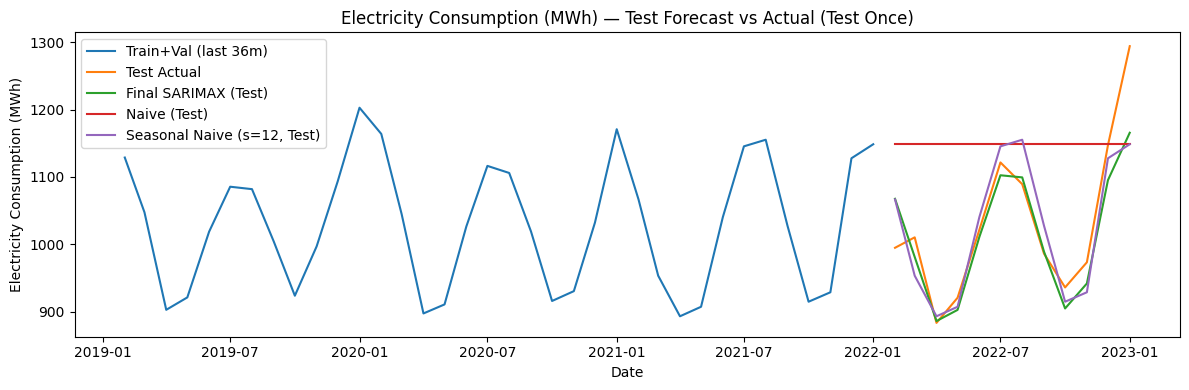
  • Compared naive and seasonal naive baselines against ETS and tuned SARIMAX models before the final refit.
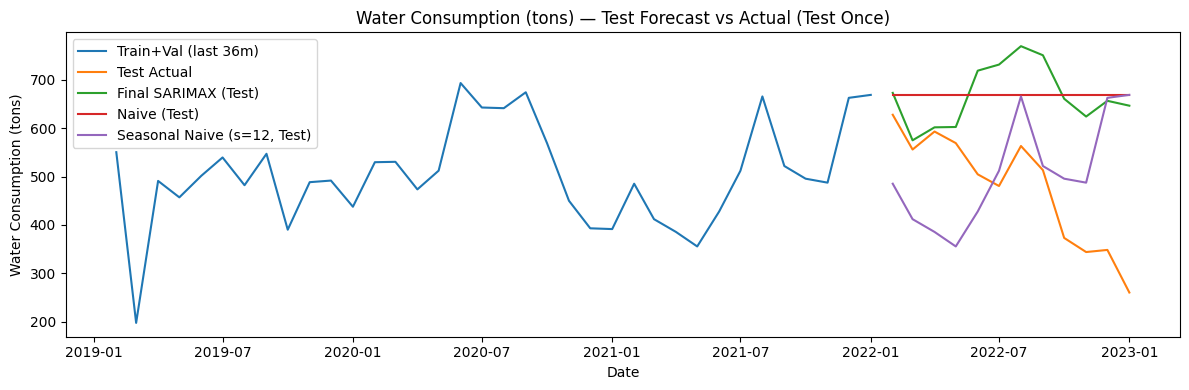
  • Reported uneven outcomes honestly: gas and electricity improve on baselines, while water remains weak on test.
Electricity forecast
Held-out electricity consumption forecast versus actual values with baseline comparisons

Gas

Gas forecast
Held-out gas consumption forecast versus actual values with baseline comparisons

Water

Water forecast
Held-out water consumption forecast versus actual values with baseline comparisons

What it demonstrates

Strong evaluation discipline, time-aware modeling, and a willingness to keep the page technically credible by reporting where the workflow still struggles.

Clustering

Customer Segmentation

The strongest unsupervised-learning entry in the repo. It compares KMeans, Gaussian Mixture Models, and Ward clustering across multiple feature sets, then uses stability and interpretability to justify the final solution instead of forcing a single metric story.

  • Tested four feature-set variants, including encoded gender and an engineered spend-to-income ratio.
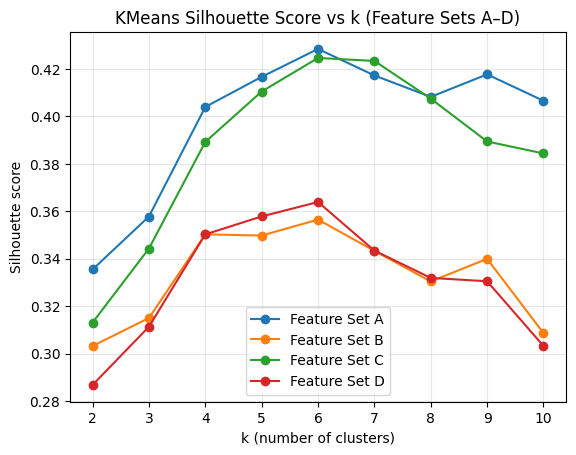
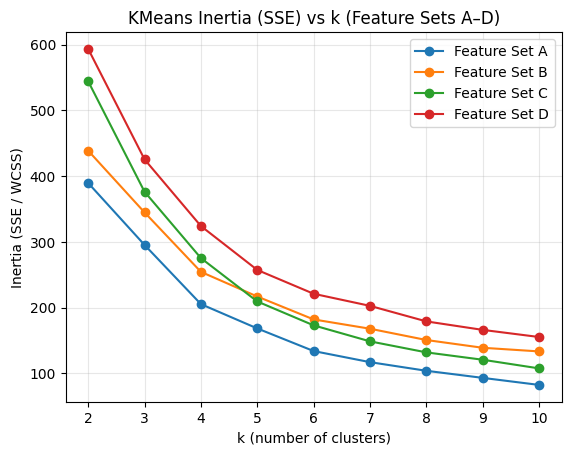
  • Used silhouette, inertia or AIC/BIC, minimum cluster size, and repeated-seed stability with ARI.
  • Rejected the extra features when they did not improve the evidence and settled on a six-cluster KMeans solution.
Silhouette comparison
KMeans silhouette score comparison across cluster counts for the customer segmentation project
Inertia comparison
KMeans inertia comparison across cluster counts for the customer segmentation project

These comparisons make the final cluster-count choice legible instead of arbitrary.

What it demonstrates

Evidence-led clustering, restraint in feature selection, and clear interpretation through PCA, profiling, and customer personas.

Regression

House Price Regression

A technically clean regression workflow built around mixed-feature preprocessing, lightweight feature engineering, and comparison between regularized linear models and ensemble regressors. It is better framed as a careful workflow than as a benchmark pricing system.

  • Used a log-transformed target alongside engineered size and room-ratio features.
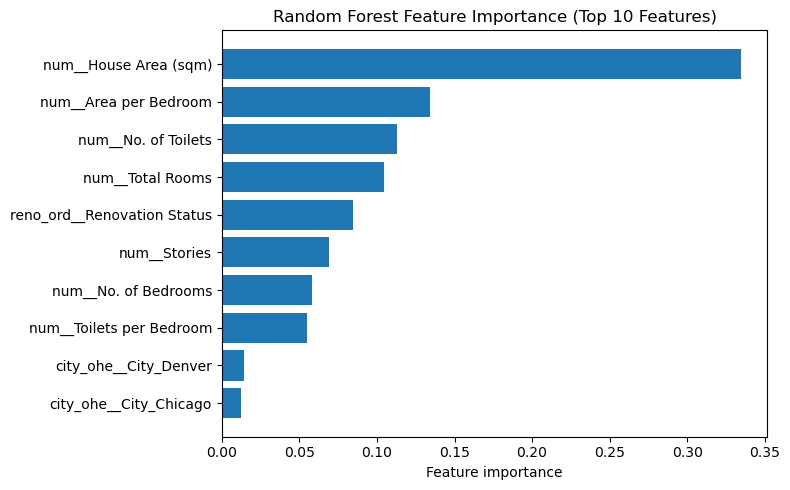
  • Built a pipeline with scaled numeric features, one-hot city encoding, and ordinal renovation status.
  • Final tuned Random Forest slightly outperformed Ridge, ending at 0.502 test R2 and 24.16% MAPE on the original scale.
Feature importance
Random forest feature importance chart for the house price regression project

What it demonstrates

Clean tabular regression structure, mixed-feature handling, and interpretation through feature importance and residual analysis without overselling the result.

Cross-project patterns

  • Preprocessing is made explicit instead of being buried in notebook state.
  • Baselines are established before tuning or final model claims.
  • Metrics change with the task rather than being reused mechanically across projects.
  • Feature engineering is selective and is dropped when it does not improve the evidence.
  • Interpretation is part of the workflow through feature importance, residual analysis, cluster profiling, and confusion matrices.
  • Limitations and uneven outcomes are reported openly instead of being hidden behind the strongest score.

Model evaluation discipline

  • Classification. Minority-class F1, precision, recall, and the confusion matrix matter more than accuracy alone.
  • Regression. Results are reported on both transformed and original price scales so error stays interpretable.
  • Segmentation. Model choice uses internal quality metrics, minimum cluster size, stability checks, and interpretability because there is no ground truth.
  • Forecasting. Diagnostics stay train-only, model selection is validation-led, and the held-out test split is used once after selection.

What ties it together

The through-line here is not one headline metric. It is that the evaluation logic changes with the problem while the discipline stays consistent.

What I learned

  • Evaluation design is part of the model, not a final reporting step.
  • Extra features only earn their place when they improve quality, stability, or usability.
  • Simple baselines can be difficult to beat, especially in forecasting.
  • Tradeoffs, failure modes, and interpretation matter as much as the best result.
  • Strong ML work is not just about accuracy. It depends on making data handling, model choice, and evaluation logic easy to trust.